DDV
Information
Tools
Data
Welcome to the ENDURE-project
ENDURE is the abbreviation for ENsuring DUne REsilience. The ENDURE-project aims to improve coastal adaptation to climate change, focusing on 110km of sand dunes located in the Interreg 2 Seas area. Six partners from The Netherlands, Belgium, France and the UK are involved in the project. ENDURE aims to improve the capacity of 2 Seas stakeholders to apply ecosystem-based management approaches, reducing reliance on hard engineering solutions.
The project draws from cross border expertise to inform and supply new purpose-developed solutions to answer real world dune management problems occurring now under climate change. Our partnership has been carefully constructed to include national, regional and local partners to really drive change into clear, practical improvements in dune management across the 2 Seas area.
All partners will collaborate to capitalise on the best knowledge and expertise available across the member states. We work to improve and restore the ability of dunes to act as adaptive, living sea defenses for a coastline which is more naturally resilient to erosion, flooding and sea level rise. In order to visualize this, the ENDURE viewer has been developed. ENDURE is receiving funding through the Interreg 2 Seas program and will last four years, finishing in December 2021.
Further information about the wider project and partners can be found on the project website here: http://www.endure.eu.com
NOTE! The viewer and its tools perform best using the Google Chrome browser.
A platform developed in collaboration with:
By the following partners:
And developed by:
ENDURE viewer
This viewer is designed to give 2 Seas Region stakeholders insight in the effects of modelled sea level rise and the changing shoreline profile. Other tools (the impact of buildings on dunes and the health of marram grass) can be found at the ENDURE website. It is not expected that it will enable these groups to make precise dune management decisions at specific sites, instead it is a communication tool designed to get people thinking about dune management in a new way. It will support stakeholders in learning about ecosystem-based solutions and new technology, helping to grow understanding of the impacts of a range of dune management techniques. Greater knowledge and understanding of dune management practices will in turn help to influence decision-making processes and generate lasting impact.
The viewer provides tools:
Marram grass health (DATA) is added, to visualise the health of a dune based on marram grass coverage and health of the plants (based on samples by our university partner). These maps show for example the spatial configuration of marram grass, the expected biodiversity of invertebrates and the infestation of the marram grass roots. This will enable users to instantly see which areas are in good health or not. Of course, this does not show the flood resistance of the dunes. Instead it shows their biological and morphological health.
Further information about the wider project and partners can be found on the project website here: http://www.endure.eu.com
NOTE! The viewer and its tools perform best using Google Chrome browser.
This viewer is designed to give 2 Seas Region stakeholders insight in the effects of modelled sea level rise and the changing shoreline profile. Other tools (the impact of buildings on dunes and the health of marram grass) can be found at the ENDURE website. It is not expected that it will enable these groups to make precise dune management decisions at specific sites, instead it is a communication tool designed to get people thinking about dune management in a new way. It will support stakeholders in learning about ecosystem-based solutions and new technology, helping to grow understanding of the impacts of a range of dune management techniques. Greater knowledge and understanding of dune management practices will in turn help to influence decision-making processes and generate lasting impact.
The viewer provides tools:
- Sea level rise effects: In this tool sea level rise effects occurring with a defined return period and sea level rise are simulated for a specific location.
- Shoreline changes (1984-2016): In this tool long-term shoreline changes can be requested for a specific location.
Marram grass health (DATA) is added, to visualise the health of a dune based on marram grass coverage and health of the plants (based on samples by our university partner). These maps show for example the spatial configuration of marram grass, the expected biodiversity of invertebrates and the infestation of the marram grass roots. This will enable users to instantly see which areas are in good health or not. Of course, this does not show the flood resistance of the dunes. Instead it shows their biological and morphological health.
Further information about the wider project and partners can be found on the project website here: http://www.endure.eu.com
NOTE! The viewer and its tools perform best using Google Chrome browser.
On this viewer page the concepts relating to the viewer tools sea level rise and shoreline change are explained. The sea level rise tool was developed by Deltares for ENDURE (Eleveld et al., in prep.). The shoreline change tool is based on the NATURE Scientific Reports publication The State of the World's Beaches
Some additional background information about the terminology used per tool:
Tool 'Sea level rise effects'
This tool shows the impact of sea level rise on specific locations. In the sea level rise tool a return period (1/100 or 1/1000 years) and sea level rise (0.5, 1 or 2 metres) should be specified and the user retrieves information on the impact on the dunes at this specific locaiton.
Return Period The return period estimates the time interval between events of a similar size or intensity and it is generally expressed in percentages. In this viewer a return period of 100 or 1000 years can be chosen. A return period of 100 years means the probability of the event occurring being 1/100, or 1% in any one year. It does not suggest that a 100-year return period means an event can only happen every 100 years. In any given year, there is a 1% chance it will happen, regardless of when the last similar event was.
The output of the tool consists of several figures, representing the current state for coastal morphology, the state with sea level rise and the state with sea level rise and the parameters.
The current state and state with sea level rise In figures 1 and 2 the effect of sea level rise on the first dune row is being displayed. In both figures the yellow coloured part of the figure represents the sandy profile, the dunes. The profile of the first dune row under the present sea level is indicated by the orange line. The effect of sea level rise is displayed by the second figure in which the red line represents the shifted profile under sea level rise. The area of dune in between the red and orange line will disappear due to coastal erosion caused by the sea level rise, which causes a shift in the dune profile landward.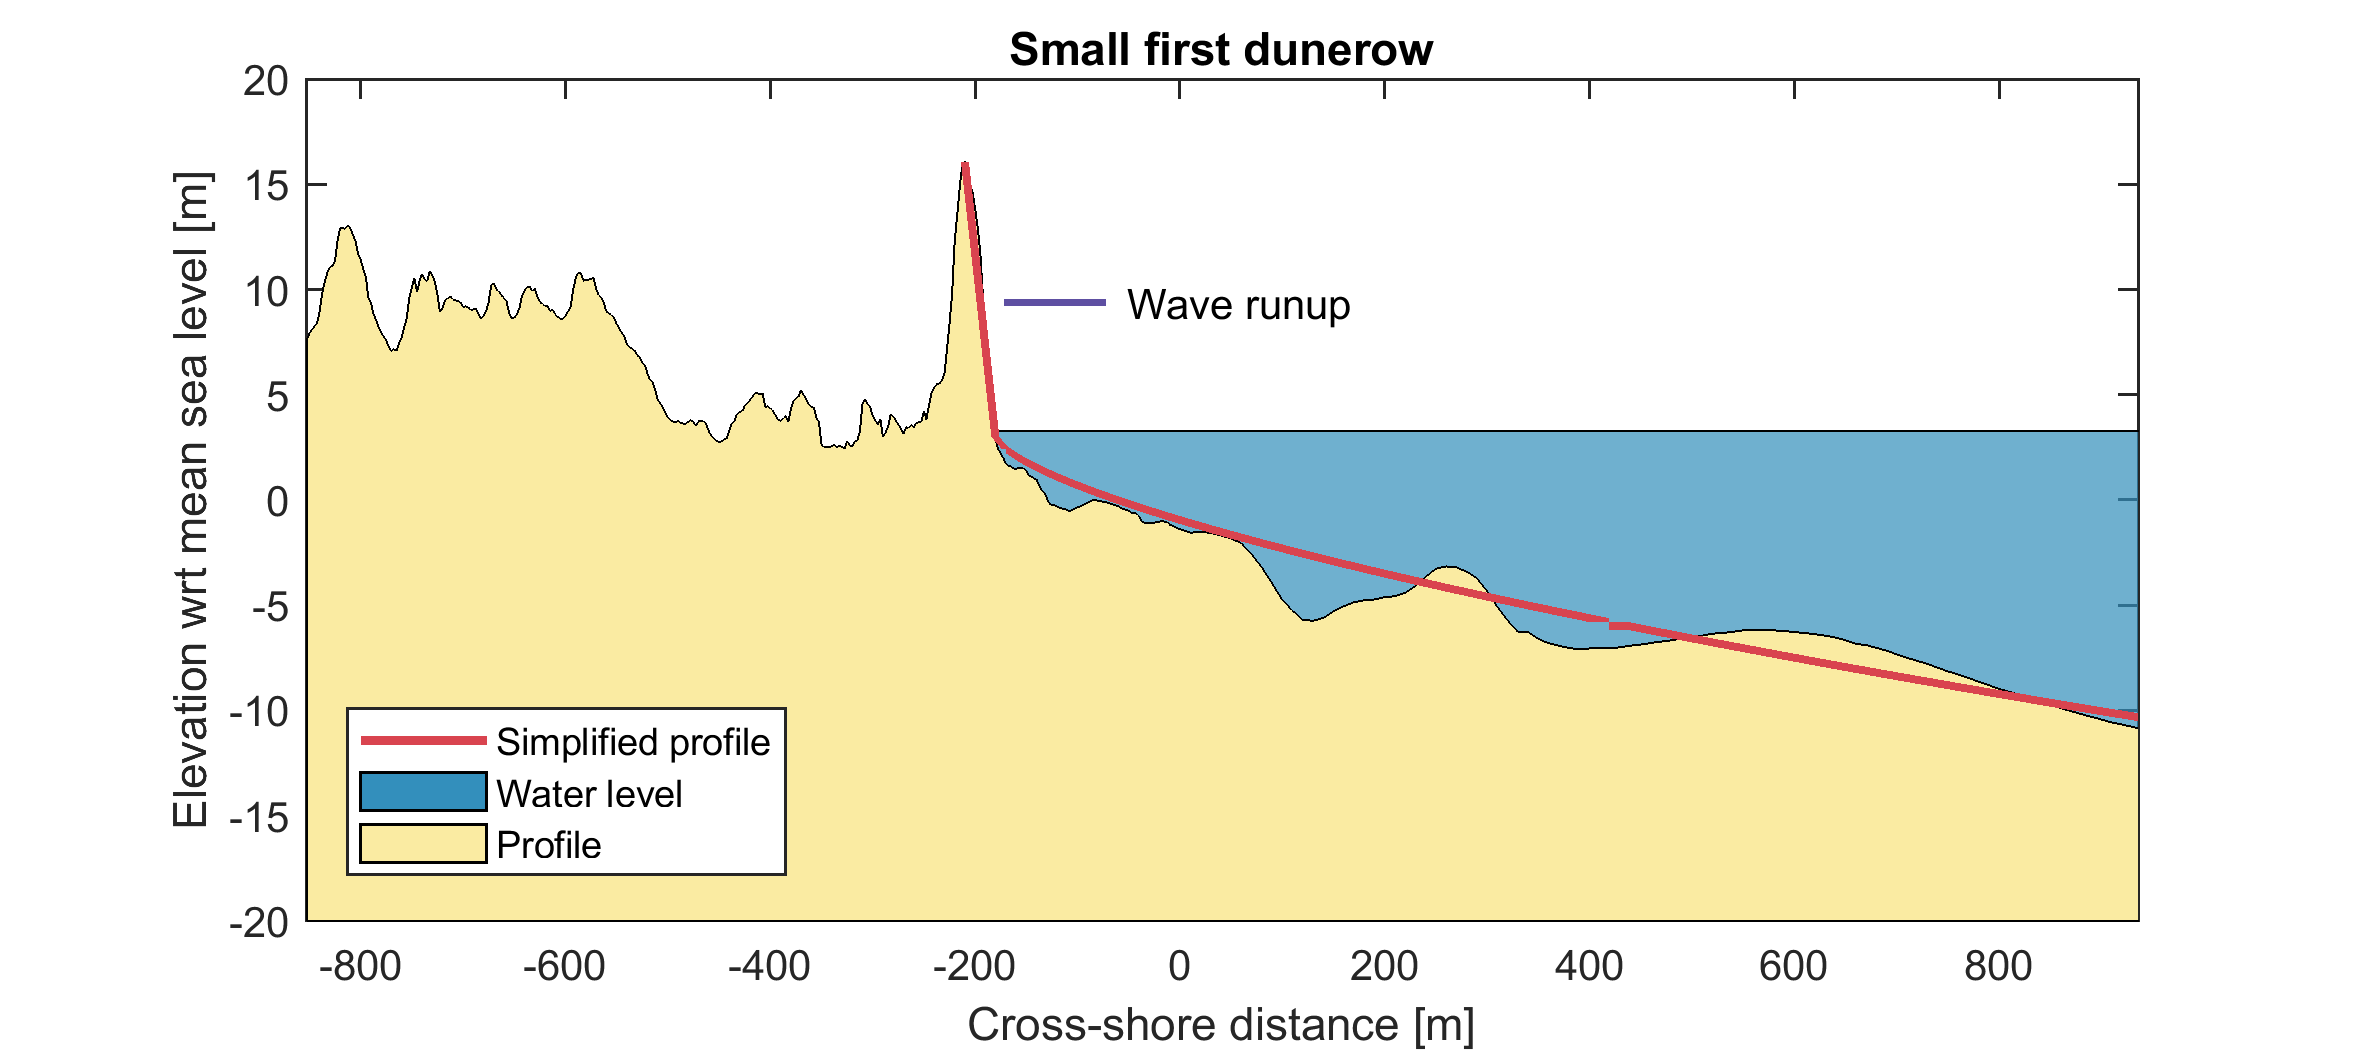
Figure 1. Dune profile without sea level rise.
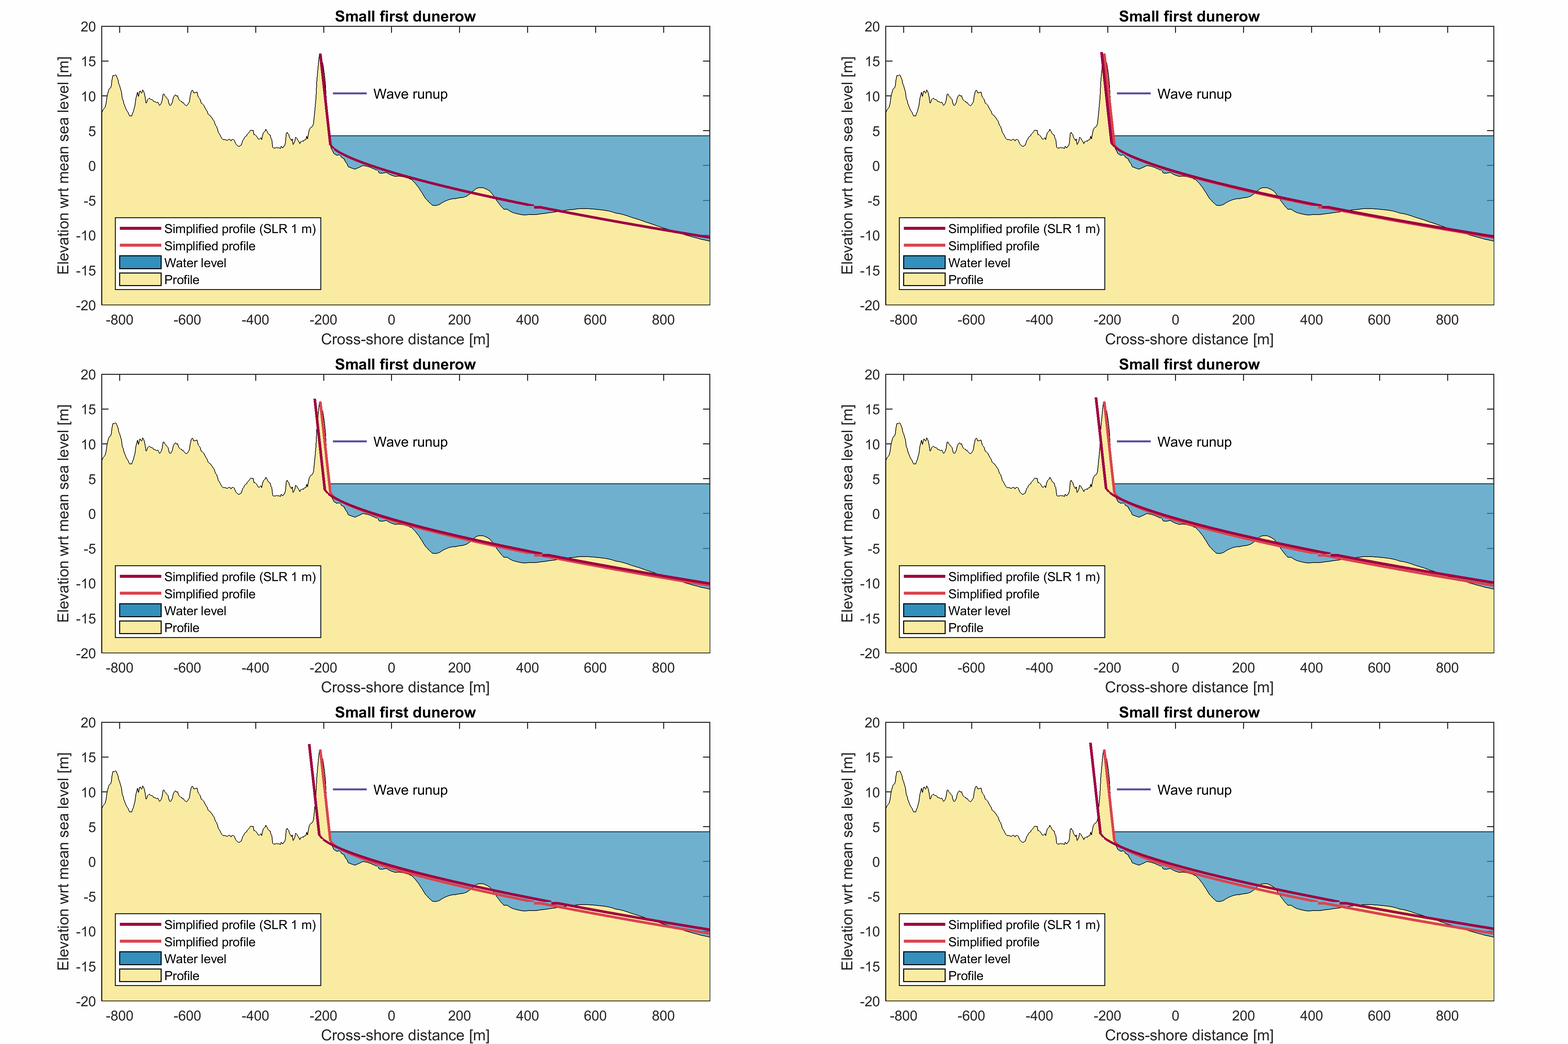
Figure 2. Sea level rise effects causes a shifting dune profile.
Storm-Impact Scale Regimes To assess the impact of sea level rise on coastal systems, storm impact scales are used (as proposed by the paper Sallanger 2000 'Storm Impact Scale for Barrier Islands'). For dune systems, four different types of regimes are distinguished describing the state of the system: swash, collision, overwash and inundation.
In the tool it is assessed what the regime of the present situation is and how this would change with 0.5, 1 or 2 metres of sea level rise. This gives insight into how well the dune system might adapt to sea level rise. Figure 3 shows the cross section of a dune, including the common terminology.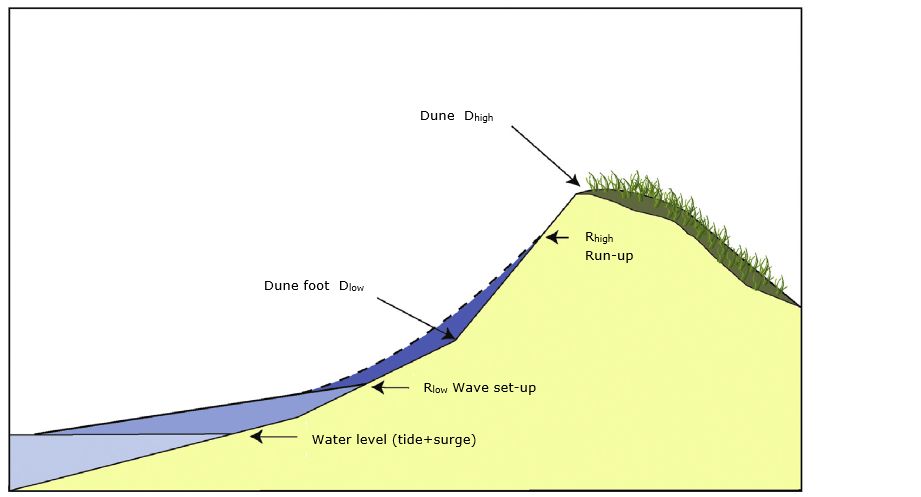
Figure 3. Cross section of a dune.
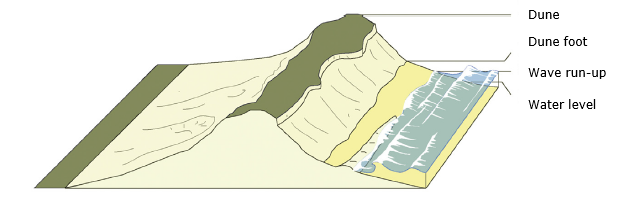
Figure 4 Swash regime.
Collision regime* The collision regime is describing a storm where the wave run-up exceeds the dune foot but is below the top of the dune. The front of the dune is impacted by the storm.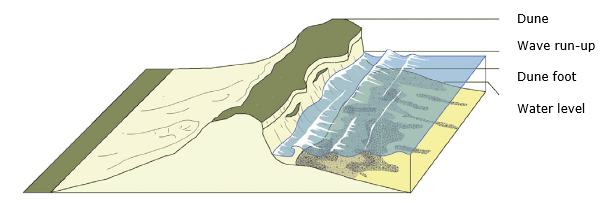
Figure 5 collision regime.
Overwash regime* The overwash regime describes a storm where wave run-up overtops the top of the dune. Because the sediment is transported landwards, the overtopping waves may lead to flooding issues in the hinterland.
Figure 6 overwash regime
Inundation regime* The inundation regime describes a storm where the storm surge is sufficient to completely and continuously submerge the dune system. A lot of sediment is transported landward and there is significant flooding of the hinterland.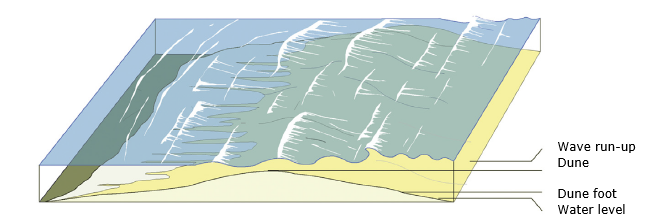
Figure 7 inundation regime.
* source: All showed figures of the mentioned regimes are courtesy of Goslin, Jérôme & Clemmensen, Lars. (2017). Proxy records of Holocene storm events in coastal barrier systems: Storm-wave induced markers. Quaternary Science Reviews. 174. 80-119. 10.1016/j.quascirev.2017.08.026.
Calculation of storm impact scale regimes To determine the storm impact regimes of Sallanger, multiple steps have been performed. These calculations are done using the values presented in the tab Parameters.
At first it is calculated how much wave run-up there is for the selected return period extreme event, using the relations given by Stockdon et al. 2007. The wave length is: L0 = (g * Tp ^ 2) / (2 * pi). Therefore the runup that is exceed by 2% of the waves is then: R2% = 1.1 * (0.35 * Beach_slope * (Hs * L0) ^ 0.5 + ((Hs * L0 * (0.563 * Beach_slope * 2 + 0.004)) ^ 0.5) / 2). Hereby Beach_slope is the beach slope between the dune foot and the location of the Mean High Water (MHW) value. Hs is the offshore significant wave height from the table and Tp the Offshore peak wave period. Based on this, the supplied storm surge level and the chosen sea level rise value, the maximum runup is calculation by summing up these values. This gives the value Rhigh. Additionally the Rlow is calculated by summing storm surge level with the wave setup. For the wave setup the formula is the following: setup = 0.35 * Beach_slope * (Hs * L0) ^ 0.5. Based on these values Rhigh and Rlow it is determined in what regime the current state and chosen scenario is (see figure).
In case the regime is in the collision regime, some additional calculations are done. Using the Bruun rule there can be estimated how far the coast would retreat based on a certain sea level rise in case the dune system could fully adapt. To calculate this at first the Depth of Closure (DoC) is needed, this is the depth where it is assumed that deeper than this no significant sediment transport takes place. The formula of Hallermeijer(1981) supplies this based on the wave conditions that are only exceeded 12 hours per year (Hs,year & Tp,year): DoC = 2.28 * Hs,year - 68.5 * (Hs,year ^2 ) / (g * (Tp,year)^2). Now the distance L between the top of the dune (dune_top ) and the DoC is calculated from the transect, which is used for the Bruun rule: Bruun = SLR * L / (DoC + dune_top). This gives the retreat of the dune in meters for the given sea level rise (SLR). It can happen that the prediction is that a profile will stay in the same collision regime, but still maybe will not adapt sufficiently to sea level rise. This can happen when the dune is insufficiently wide compared to the retreat of the dune. Then the dune must retreat landwards through natural processes or sediment management.
Some additional background information about the terminology used per tool:
Tool 'Sea level rise effects'
This tool shows the impact of sea level rise on specific locations. In the sea level rise tool a return period (1/100 or 1/1000 years) and sea level rise (0.5, 1 or 2 metres) should be specified and the user retrieves information on the impact on the dunes at this specific locaiton.
Return Period The return period estimates the time interval between events of a similar size or intensity and it is generally expressed in percentages. In this viewer a return period of 100 or 1000 years can be chosen. A return period of 100 years means the probability of the event occurring being 1/100, or 1% in any one year. It does not suggest that a 100-year return period means an event can only happen every 100 years. In any given year, there is a 1% chance it will happen, regardless of when the last similar event was.
The output of the tool consists of several figures, representing the current state for coastal morphology, the state with sea level rise and the state with sea level rise and the parameters.
The current state and state with sea level rise In figures 1 and 2 the effect of sea level rise on the first dune row is being displayed. In both figures the yellow coloured part of the figure represents the sandy profile, the dunes. The profile of the first dune row under the present sea level is indicated by the orange line. The effect of sea level rise is displayed by the second figure in which the red line represents the shifted profile under sea level rise. The area of dune in between the red and orange line will disappear due to coastal erosion caused by the sea level rise, which causes a shift in the dune profile landward.

Figure 1. Dune profile without sea level rise.

Figure 2. Sea level rise effects causes a shifting dune profile.
Storm-Impact Scale Regimes To assess the impact of sea level rise on coastal systems, storm impact scales are used (as proposed by the paper Sallanger 2000 'Storm Impact Scale for Barrier Islands'). For dune systems, four different types of regimes are distinguished describing the state of the system: swash, collision, overwash and inundation.
In the tool it is assessed what the regime of the present situation is and how this would change with 0.5, 1 or 2 metres of sea level rise. This gives insight into how well the dune system might adapt to sea level rise. Figure 3 shows the cross section of a dune, including the common terminology.

Figure 3. Cross section of a dune.
- The following concepts can be distinguished in the figures:
- Dune: a hill of wind-blown sand that protects the hinterland against the sea.
- Dune foot: the starting point of a dune nearest to the sea.
- Dune throat: an opening in the dune, caused by a washover.
- Washover: a dune location where a flow of water and sediment has overtopped the dune.
- Wave run-up: the maximal vertical extent of wave uprush on a beach or dune above the still water level.
- Swash regime:
- · Wave run-up < dune foot.
- · Impacts restricted to the beach face.
- · Erosion induced beach scarp and berm formation.
- · Offshore sediment transportation.

Figure 4 Swash regime.
Collision regime* The collision regime is describing a storm where the wave run-up exceeds the dune foot but is below the top of the dune. The front of the dune is impacted by the storm.
- Collision regime:
- · Dune foot < wave run-up < dune.
- · Large impacts on beach and dune front.
- · Erosional scarp in the dune cliff.
- · Intense offshore sediment transportation.

Figure 5 collision regime.
Overwash regime* The overwash regime describes a storm where wave run-up overtops the top of the dune. Because the sediment is transported landwards, the overtopping waves may lead to flooding issues in the hinterland.
- Overwash regime:
- · Wave run-up > dune.
- · Waves locally overtop the dune in its lower parts.
- · Washover deposition.
- · Occasional breaching and marine water intrusion to the rear of the dunes.

Figure 6 overwash regime
Inundation regime* The inundation regime describes a storm where the storm surge is sufficient to completely and continuously submerge the dune system. A lot of sediment is transported landward and there is significant flooding of the hinterland.
- Inundation regime:
- · Wave run-up > dune.
- · General overtopping of the dune and flattening of the dune topography.
- · Massive landward sediment transportation and deposition.
- · Deep ecological impacts due to massive salt water inundation to the rear of the dunes.

Figure 7 inundation regime.
* source: All showed figures of the mentioned regimes are courtesy of Goslin, Jérôme & Clemmensen, Lars. (2017). Proxy records of Holocene storm events in coastal barrier systems: Storm-wave induced markers. Quaternary Science Reviews. 174. 80-119. 10.1016/j.quascirev.2017.08.026.
Calculation of storm impact scale regimes To determine the storm impact regimes of Sallanger, multiple steps have been performed. These calculations are done using the values presented in the tab Parameters.
At first it is calculated how much wave run-up there is for the selected return period extreme event, using the relations given by Stockdon et al. 2007. The wave length is: L0 = (g * Tp ^ 2) / (2 * pi). Therefore the runup that is exceed by 2% of the waves is then: R2% = 1.1 * (0.35 * Beach_slope * (Hs * L0) ^ 0.5 + ((Hs * L0 * (0.563 * Beach_slope * 2 + 0.004)) ^ 0.5) / 2). Hereby Beach_slope is the beach slope between the dune foot and the location of the Mean High Water (MHW) value. Hs is the offshore significant wave height from the table and Tp the Offshore peak wave period. Based on this, the supplied storm surge level and the chosen sea level rise value, the maximum runup is calculation by summing up these values. This gives the value Rhigh. Additionally the Rlow is calculated by summing storm surge level with the wave setup. For the wave setup the formula is the following: setup = 0.35 * Beach_slope * (Hs * L0) ^ 0.5. Based on these values Rhigh and Rlow it is determined in what regime the current state and chosen scenario is (see figure).
In case the regime is in the collision regime, some additional calculations are done. Using the Bruun rule there can be estimated how far the coast would retreat based on a certain sea level rise in case the dune system could fully adapt. To calculate this at first the Depth of Closure (DoC) is needed, this is the depth where it is assumed that deeper than this no significant sediment transport takes place. The formula of Hallermeijer(1981) supplies this based on the wave conditions that are only exceeded 12 hours per year (Hs,year & Tp,year): DoC = 2.28 * Hs,year - 68.5 * (Hs,year ^2 ) / (g * (Tp,year)^2). Now the distance L between the top of the dune (dune_top ) and the DoC is calculated from the transect, which is used for the Bruun rule: Bruun = SLR * L / (DoC + dune_top). This gives the retreat of the dune in meters for the given sea level rise (SLR). It can happen that the prediction is that a profile will stay in the same collision regime, but still maybe will not adapt sufficiently to sea level rise. This can happen when the dune is insufficiently wide compared to the retreat of the dune. Then the dune must retreat landwards through natural processes or sediment management.
Tool 'Shoreline changes (1984-2016)'
The shoreline change tool shows the erosion or accretion of shorelines in the Interreg 2 Seas area. The output of the tool is shown in the figure (4) below. For every year from the period 1984-2016 the location of the shoreline with relation to the landward boundary can be requested. Each blue dot represents the shoreline location in the specified country and year on the location requested in the viewer tool.
 Figure 8. Detail of Shoreline transect plot
Each dot shows the location of the shoreline in a specific year. The indicated change rates metres per year (m/yr) are obtained from fitting a line-of-best fit to the shoreline position data for each transect.
- A shoreline can be in several states of change:
- · Accretion > 0.5 m/yr.
- · Stable −0.5 to 0.5 m/yr.
- · Erosion −1 to −0.5 m/yr.
- · Intense erosion −3 to −1 m/yr.
- · Severe erosion −5 to −3 m/yr.
- · Extreme erosion <= 5 m/yr.
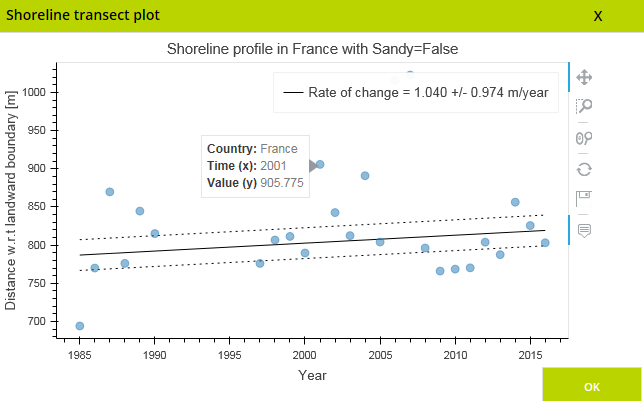
Figure 9. Output of the shoreline change tool.


