![]()


")
Attention: access to the WAS is restricted!! You will need to login first!
(Forgot your password or username? Don't have an account? Please contact This email address is being protected from spambots. You need JavaScript enabled to view it.)
The WAS integrates web-based access to Earth Observation (EO) data and field (in-situ) data with demonstration model scenarios for typical eutrophication indicators such as the 90 percentile of chlorophyll-a in the Southern North Sea (defined as the area between 6° W and 7° E longitudes and 48° - 54 ° N latitudes which includes the British Channel). The model scenarios are based on the spatial distribution pattern of salinity data and empirical relationships with other parameters that were developed in the OSPAR Program (OSPAR, 2008). The results for pristine conditions are scaled with the nitrogen river loads to obtain the indicator values for the actual and OSPAR problem limit (pristine + 50%) conditions. The nitrogen loads are based on Vermaat et al., 2012. The density and quality of these data and representativeness of the empirical relationships determine the quality of the demonstration model. The Netcdf common data format used in the WAS permits easy replacement of the demonstration model with more complex or detailed models for eutrophication. Whereas field and EO data can be used to monitor the current eutrophication status and record the history of change, models are very useful to show the future improvement of water quality for different management strategies available to the EU member states.
The key objective is to demonstrate the added value of combining field measurements from buoys and ships and EO data from satellites for comparison. The EO data are hosted by Plymouth Marine Laboratory (PML), the field data and demonstration model scenarios are stored on a geoserver at the Flemish Institute for Technological Research (VITO). Gridded information such as EO data and the model results are visualized using web services (resp. WMS and WFS). Different maps can be overlaid to produce composite results using transparent backgrounds, if necessary. In addition, the WAS provides time series graphs for trend analysis of in-situ data that have been uploaded, showing the peaks in eutrophication parameters.
The current version of the WAS is intended for demonstration purpose. The architecture permits data updates and replacement of model scenarios with results of more complex models.
Click here to enter the Web-based Application Server tool
Click here to download the WAS User Manual
A detailed manual is available online. Here we add a short summary of the system. An interactive calendar tool gives quick access to data that have been collected for particular days (see figure).
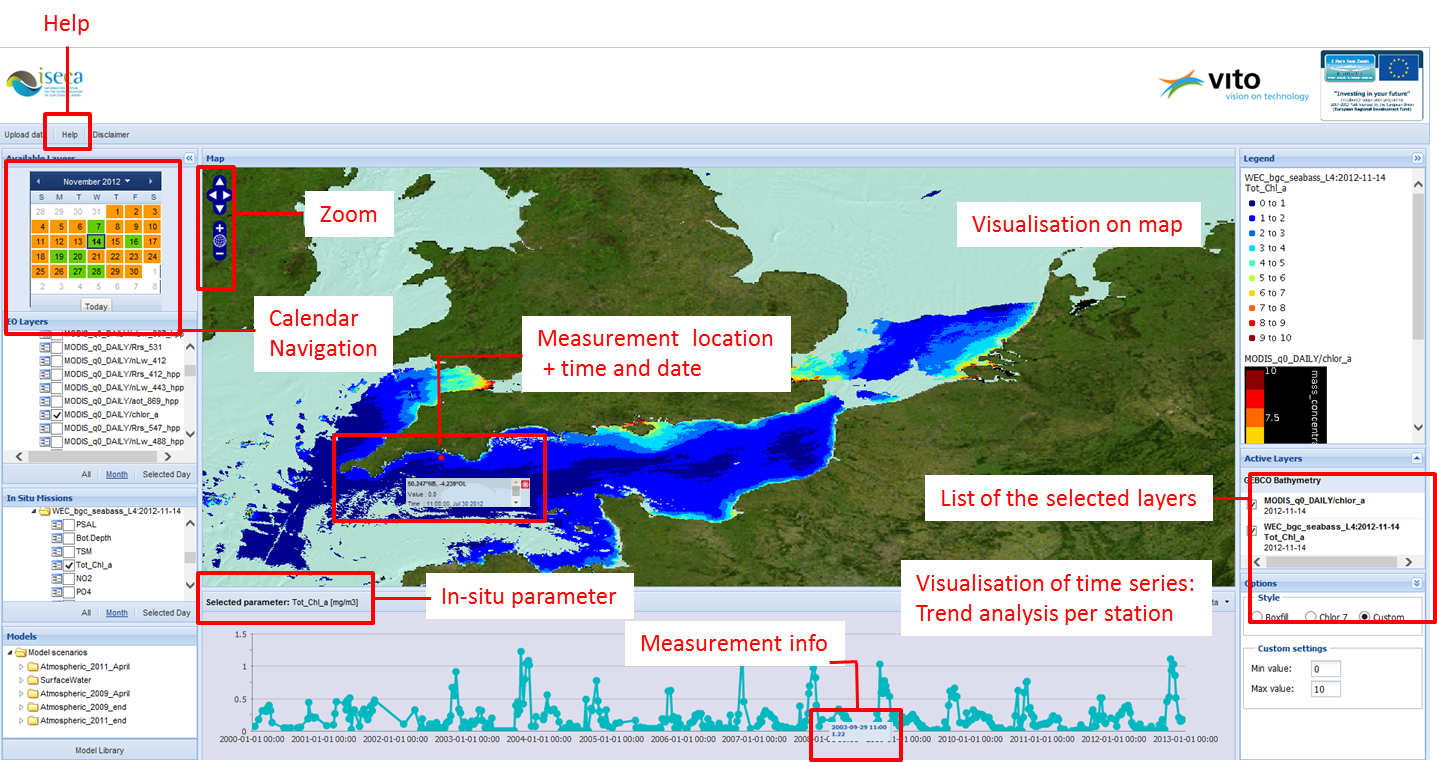 |
| General user interface of the WAS with calendar-based selection of EO and in-situ data. Below the model scenarios selection (not shown) and trend analysis chart on in-situ data. |
The field observations show up as markers on the map and graphs. All model simulations refer to long-term (yearly or seasonal) averages, and it is not possible and meaningful to compare these directly with the EO data or field measurements.
The different model scenarios are visualized with a 1x1 km resolution and stored as Climate & Forestry (CF) compliant NetCDF files. Examples of management strategies related to the scenarios for nitrogen load reduction are a strong reduction of the cattle stock size, use of fertilizer or other measures, or a combination of all options (this results in almost 80% reduction of the nitrogen load). A business-as-usual scenario is available as reference scenario. Furthermore, the atmospheric inputs of land-and sea-based emission sources such as industry and shipping play a significant role in the eutrophication processes. Therefore, the WAS also includes scenarios for atmospheric depositions. The atmospheric transport simulations carried out at the University of Greenwich (UofG) use past weather data from ECMWF (www.ecmwf.int) and a 7x7km emissions database provided by VITO for the years 1990, 2000 and 2009 (Maes et al., 2009). The atmospheric inputs are presented as deposition maps of nitrogen oxides and ammonia for each month of the studied years and for each of the industrial or agricultural sectors of interest.
More information:
- ICES, 2012. International Council for the Exploration of the Sea Oceanographic Database. 2012. ICES, Copenhagen.
- Maes J., Vliegen J., Van de Vel K., Janssen S., Deutsch F. and De Ridder K. Spatial surrogates for the disaggregation of CORINAIR emission inventories. Atmospheric Environment 43, 1246-1254. 2009.
- OSPAR, 2008. Report on the second application of the OSPAR Comprehensive procedure to the Belgian Marine Waters. Report by Belgium. Federal Public Service Health, Food Chain Safety and Environment, 70 pages. 2008. www.ospar.org.
- Vermaat, J.E., Broekx, S., Van Eck, B., Engelen, G., Hellmann, F., De Kok, J.L., Van der Kwast, H., Maes, J., Salomons, W. and Van Deursen, W., 2012. Nitrogen source apportionment for the catchment, estuary and adjacent coastal waters of the Scheldt, Special Issue - A Systems Approach for Sustainable Development in Coastal Zones, Ecology and Society 17 (2): 30.
 |
 |
 |
|
|
 |
||
|
Part-financed by ERDF through the Interreg IV A 2 Seas Programme “Investing in your Future”
“The document reflects the author's views. The INTERREG IVA 2 Seas Programme Authorities are not liable for any use that may be made of the information contained therein.” Website developed and maintained by VLIZ Subscribe This email address is being protected from spambots. You need JavaScript enabled to view it. to receive the ISECA newsletter by email |
|||||||